The S Curves tool makes it easy to create and modify an S Curve with unique adjustable UI controls.
![]()
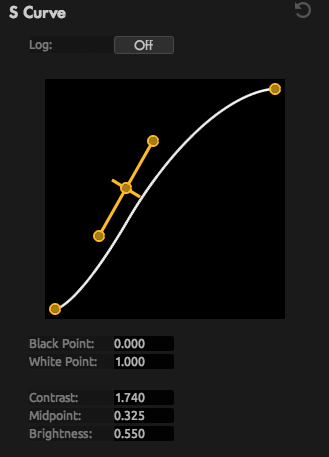
Log: When turned on, applies a color adjustment to the image to bring out detail and color in Log footage.
Curves Graph: An adjustable graph to help create an S Curve. The anchor on the bottom of the screen adjusts the Black point, while the anchor on the top adjusts the White point. Adjusting the center point of the t control, adjusts Midpoint and Brightness. Rotating the t control by clicking on the two anchors at each end adjusts the overall contrast of your image..
Black Point: Adjusts the black point of the curve.
White Point: Adjusts the white point of the curve.
Contrast: The Contrast slider helps define luminance detail. Positive/higher values add contrast bringing out detail in your image while Negative/lower values remove contrast, flatening your image. .
Midpoint: Adjusts the balance of the curve between the Black and White Points, moving the t control on a horizontal path.
Brightness: Adjusts the brightness of the image, raising and lowering the t control.
![]()